[ 2007-September-28 07:53 ]
The ns2 network simulator is a powerful tool, but unfortunately it does not provide any tools for getting results. It simply simulates a network, and provides a trace file of all the events that occured. This means that everyone goes out and writes their own tools to parse through these files. This is my attempt at creating a collection of tools for working with ns2. These tools are written in Python, and require Python 2.3. Many of them are command line tools, but all of them also expose a Python API. None of them are supported, so you'll need to figure it out yourself. Good luck! [Updated 2007-09-28: New revision and more documentation].
Included Files
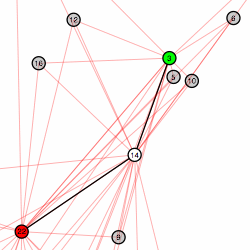
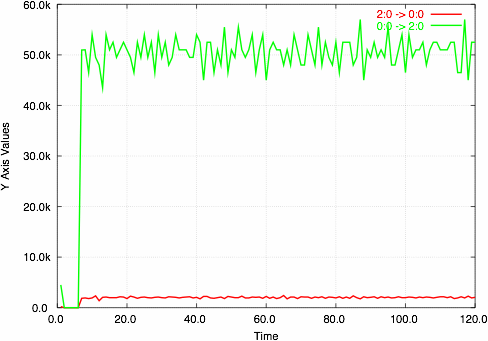
drawnetwork.m- A Mac OS X/GnuStep tool for drawing wireless networks. See the example output below.example-networks.py- Uses the tools to generate a random 25 node network, pick a random pair of nodes, perform a TCP throughput test between them, graph the results, and output the data for drawnetwork.example.py- Simple example to graph the throughputOverTime of a trace.flowanalysis.py- Python API to parse trace files. Also a command line tool to print aggregate statistics about flows in a file.frange.py- Python module: a floating-point version of the range() function.networks.py[module documentation] - Python API to generate networks, perform Dijkstra's algorithm, and create ns2 scenario scripts.ns2stats.py- Python API for running ns2 and parsing output. Also a command line tool which prints aggregate statistics for a trace (much faster than flowanalysis.py).simple.tcl- A very simple example ns2 wireless scenario.stupidplot.py- Yet another Python module for interfacing with GnuPlot. This will produce a graph like the one below, just by passing in a 2D array containing the data. The output is also customizable.throughputOverTime.py- Function/command line tool for printing the throughput for all the flows for each second of simulation.
drawnetwork Sample Output

stupidplot Sample Output
